You can use the FDO provider to display various data, such as shape data, in the current enterprise project.
Add layer using a shape connection
In this section, a layer (here “street”) is to be added to an existing display model using a shape connection.
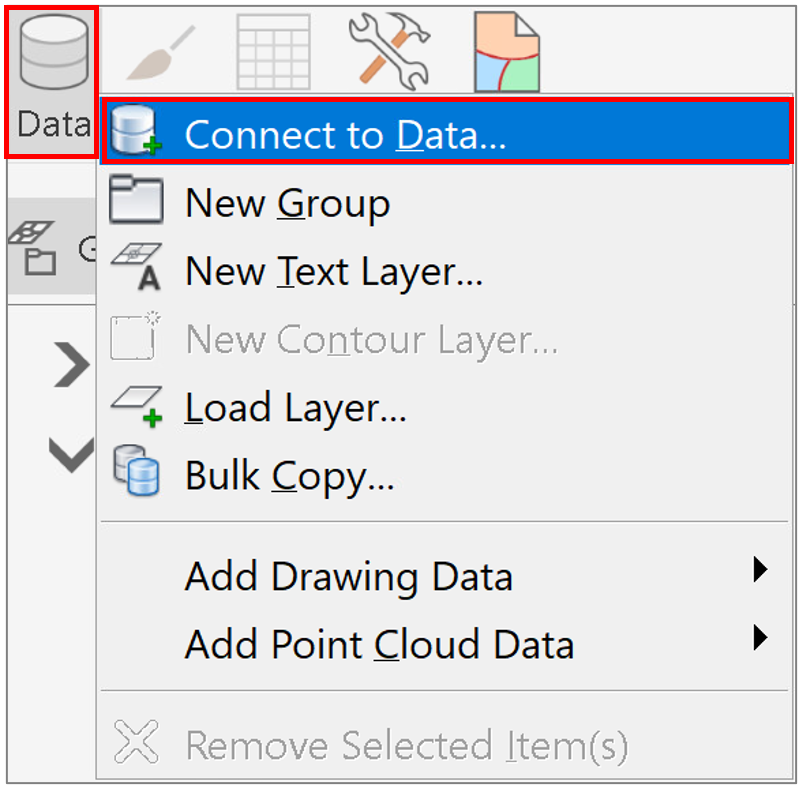
To do this, open the data connection form by clicking on the “Data” button in the display management and select “Add SHP Connection” in the left pane of the “Data Connect” window.
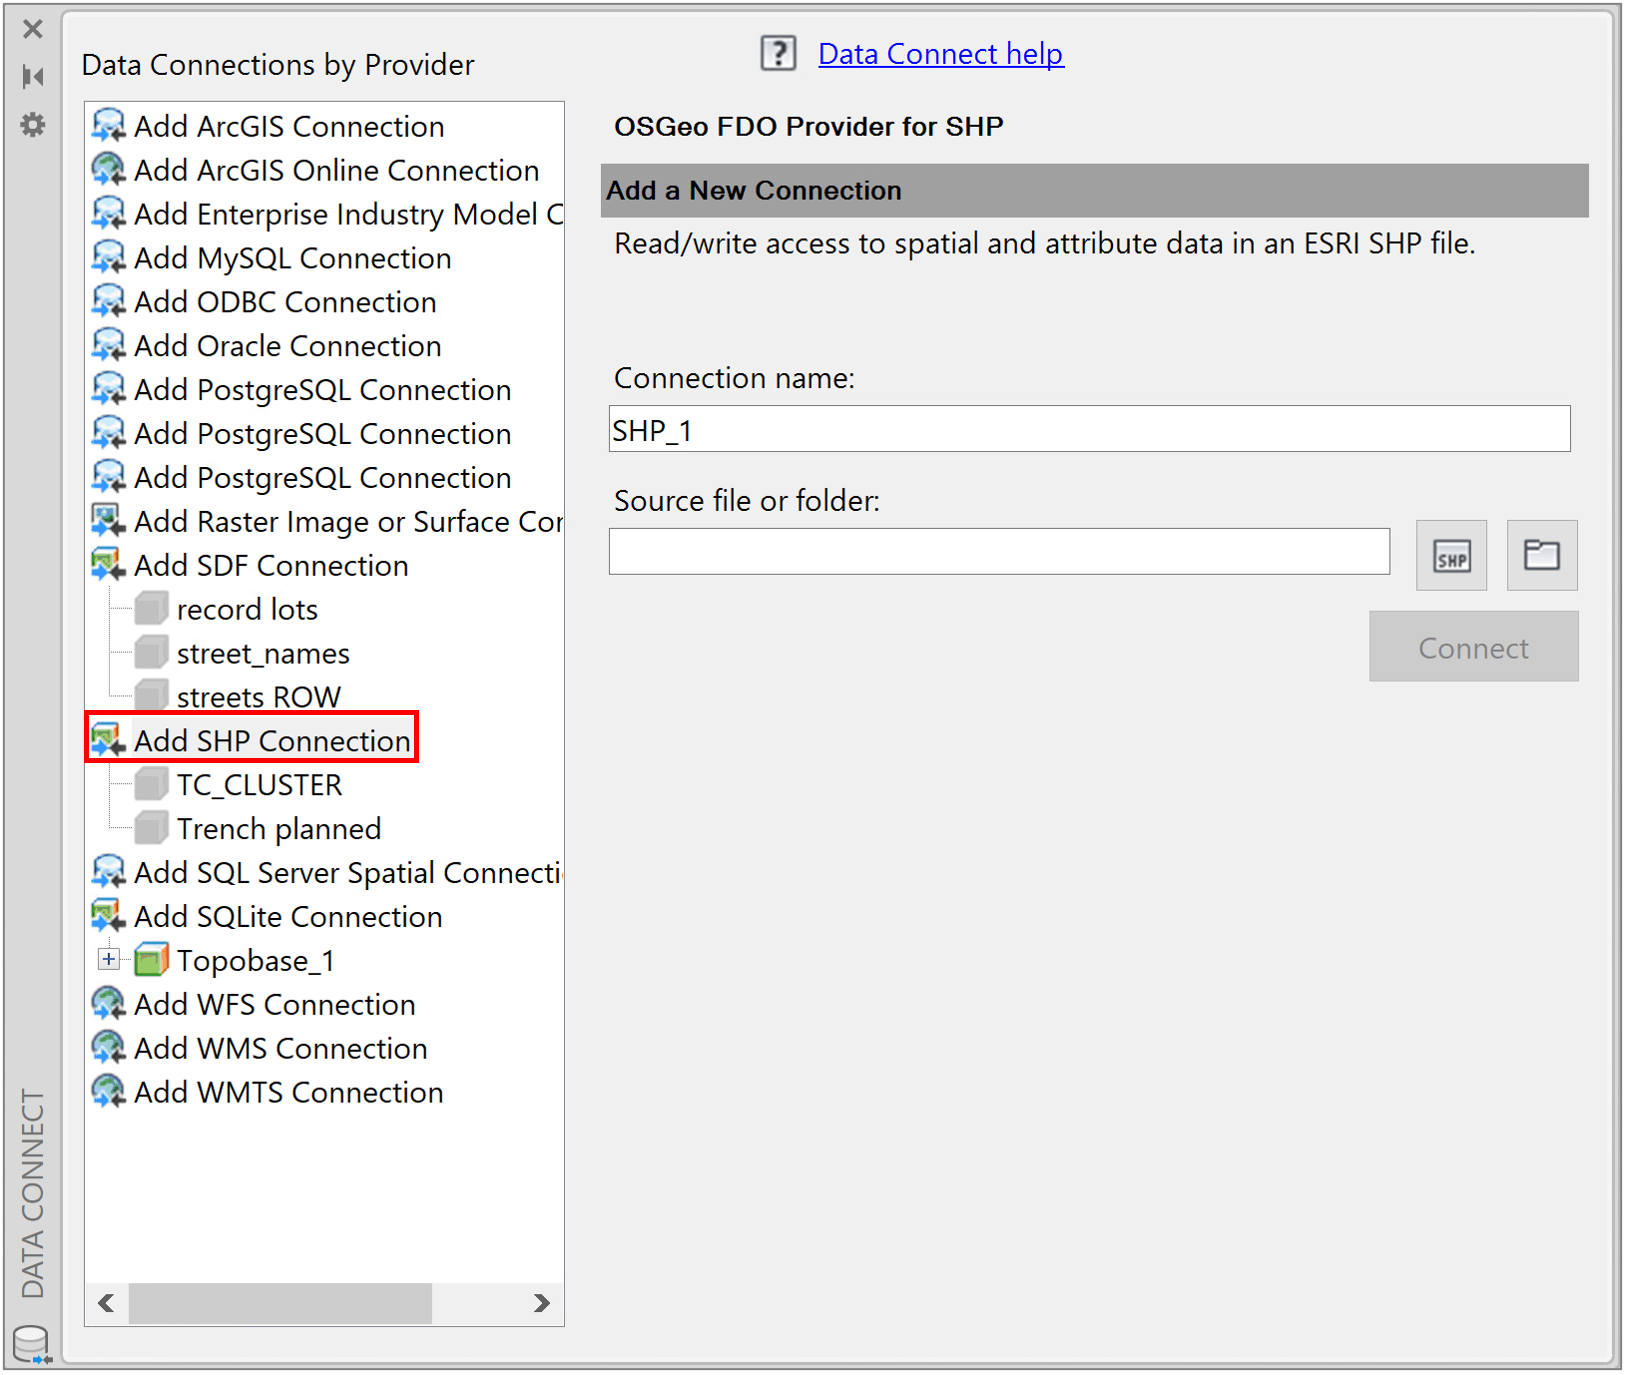
Select the appropriate shape “shp”, in this case “roads.shp”, and click on “Connect”.
![]()
Select the layer (in this case “roads”) by ticking the box.
There are two options for adding the layer to the map:
|
adds the layer to the map without a filter |
or |
adds the layer with the appropriate filter to the map |
In this example, no filter is to be set for loading the layer.
Add the layer to the map with .
Result
Note
Using shape files in a display model has the disadvantage that it slows down the display speed. Therefore, it may be advisable to always convert shape files and other external data connections to SDF files. You can find out how to proceed here.
Connect WMS service
If data from surveying offices etc. is provided as a WMS service, this service can also be connected to the project as a background map.
Procedure
Via the data button in the display management
open the form "Data connection by provider".
Select Add WMS connection here.
- Give the connection a name - this way the layer will appear in the display model.
- Add the URL of the WMS service - you can find these services e.g. on the websites of the survey offices.
- Select the version of the service. The version of the service is included in the URL, in the example of the ALKIS data of Saxony - https://geodienste.sachsen.de/wms_geosn_alkis-adv/guest?REQUEST=GetCapabilities&SERVICE=WMS&VERSION=1.3.0 it is version 1.3.0.
- If necessary, fill in the proxy settings
- and start loading the service into the project via the "Connect" button.
- It is not necessary to enter the username and password - start the connection using the Login button.
Select the required layers and add them to the project using the "Add to map" button. The coordinate systems of the source and the destination will be recognized and, if necessary, the data from the source will be transformed into the destination coordinate system.
The layer is loaded into the project and becomes visible in the display model.
The folder name corresponds to the connection name. The layer names can be edited.
Save the project when working with SQLlite or the presentation model when working in PostgreSQL projects to see the WMS services permanently in the project.
Proceed in the same way when connecting WFS and WMTS services.