In NET Engineering, both the planning and the documentation of telecommunication networks can be carried out.
Data can be collected in three different database systems: file-based in SQLite files or in PostgreSQL or Oracle databases.
Projects are created in the Infrastructure Administrator.
Planning
Planning can be imported from NET Design or performed separately in NET Engineering. In NET Engineering, the FTTx Design Wizard and Create drop workflows can be used for this purpose. The data required for this can be imported or connected as a background.
Documentation
Existing telecommunications networks can be documented either schematically or in a georeferenced manner.
Schematic
Georeferenced
The most important structural elements can be managed with geometry and shown in the graphic. Ducts and cables can be entered with their own geometries or assigned to a trench without their own geometries. The display in the graphic is controlled via the display model.
Project start
Depending on the database used, the project is opened in a file or via a database connection.
SQLite file
The SQLite file can be opened here:
 or
or 
and selected in the appropriate directory.

The opened file contains all feature classes in the Industry Model Explorer, workflows in the Workflow Explorer and the layers in the display model.

Database connection
You can connect to the database via “Open Project”.

Oracle Database

PostgreSQL database

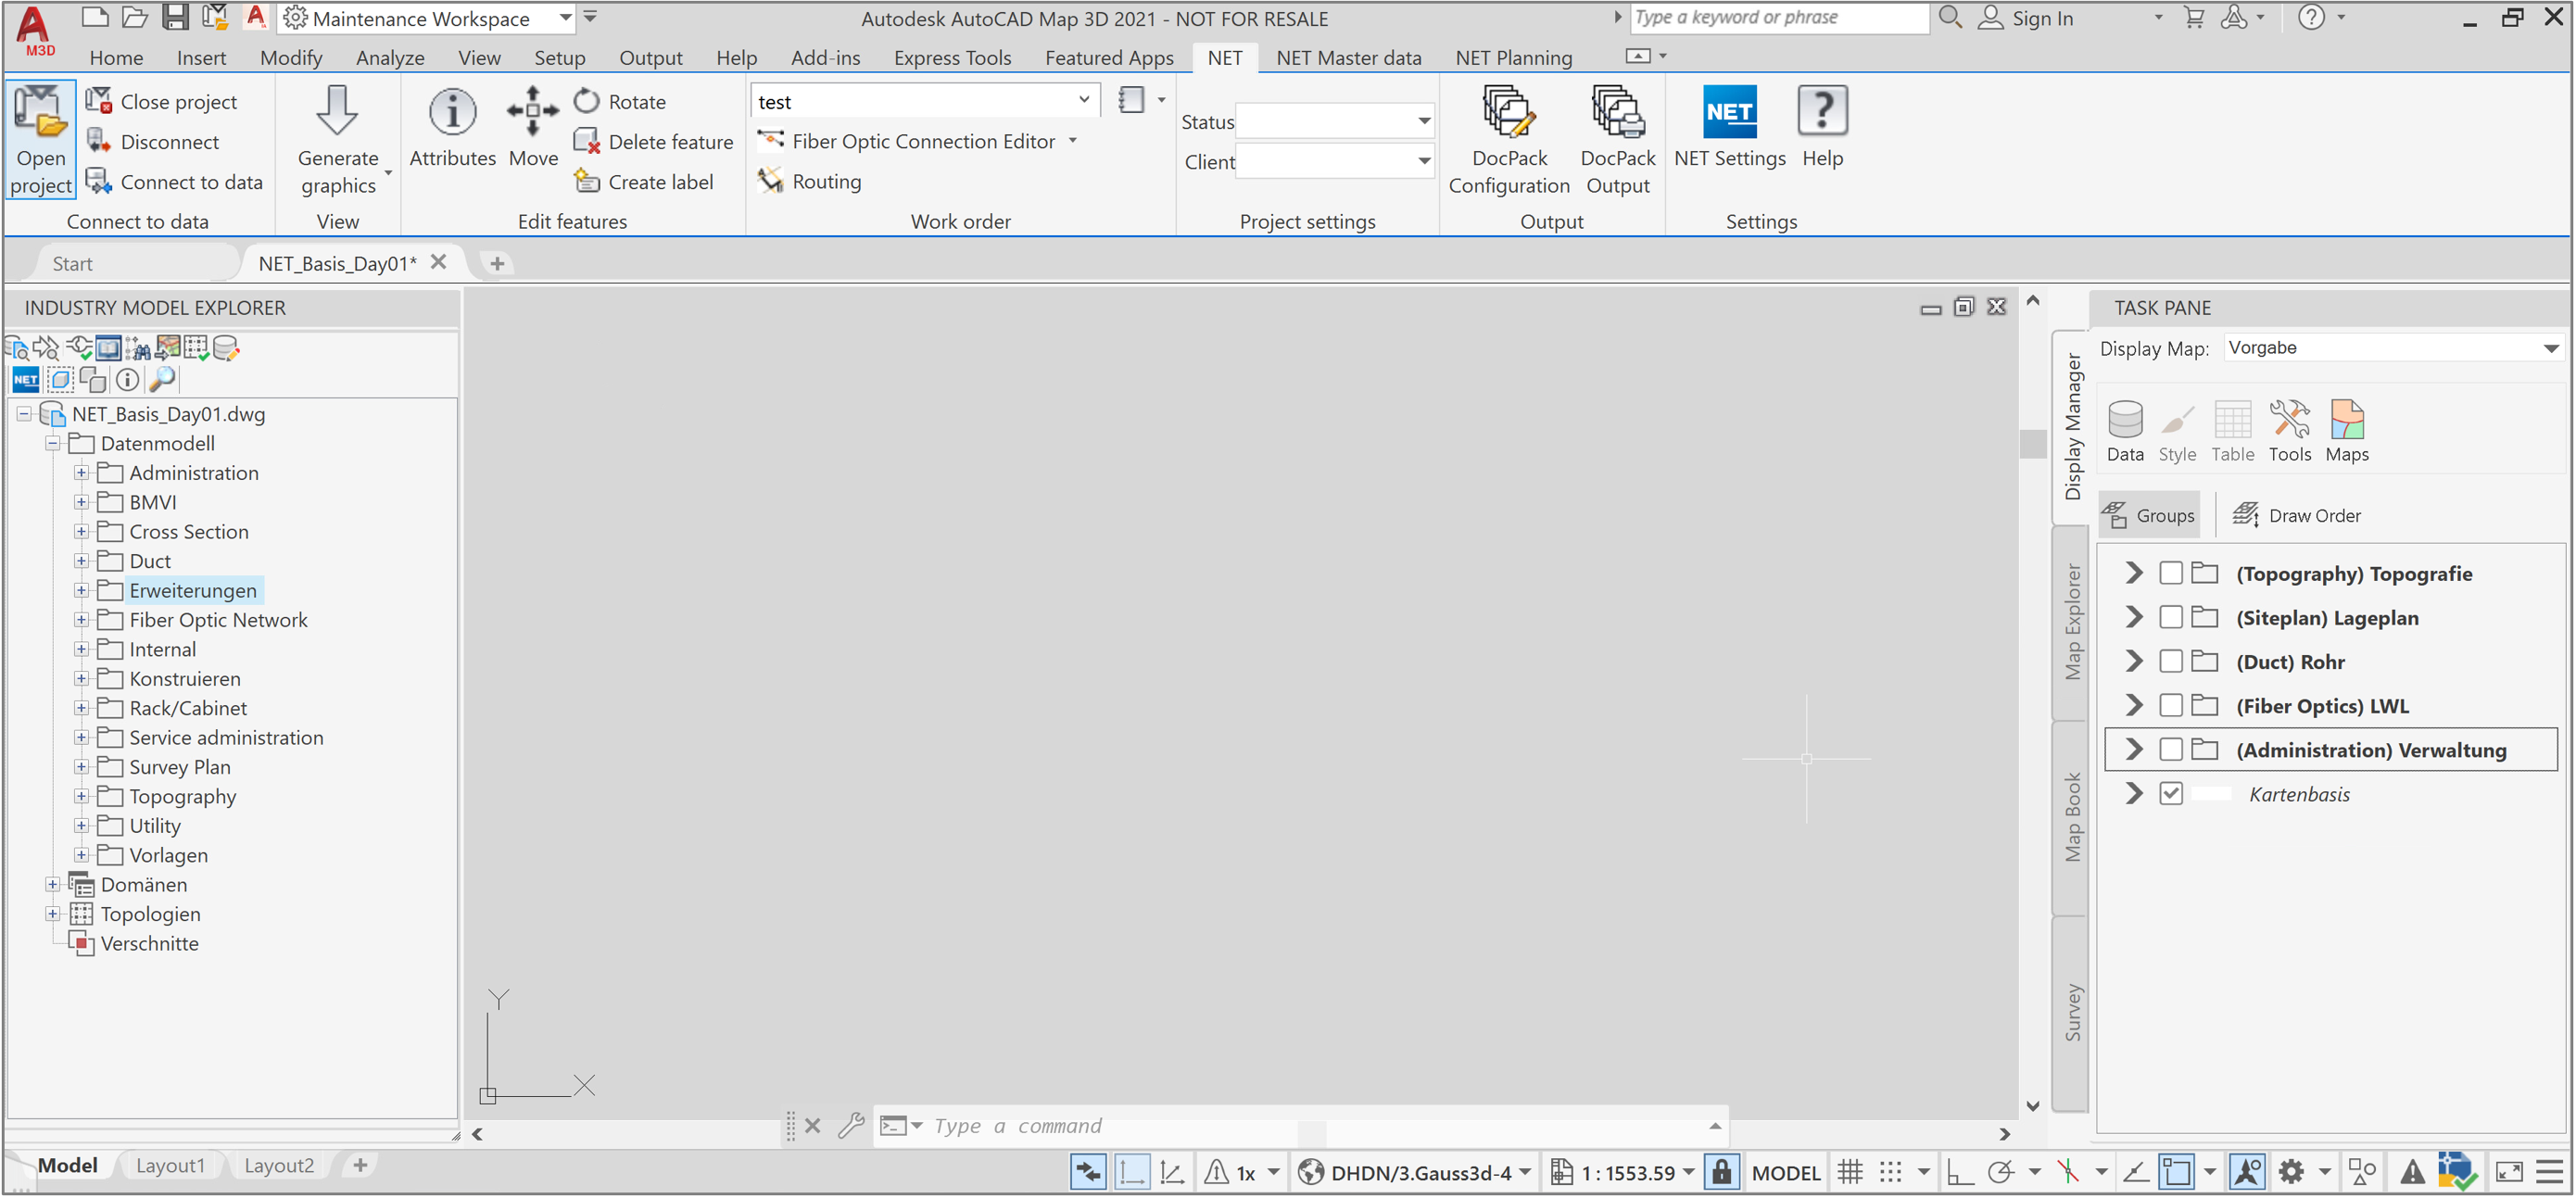
The open project contains all feature classes in the Industry Model Explorer and workflows in the Workflow Explorer:

No display model has been loaded yet and therefore no elements are visible in the graphic.
Graphic
The display model can be selected from the list (1) or opened from a directory (2).

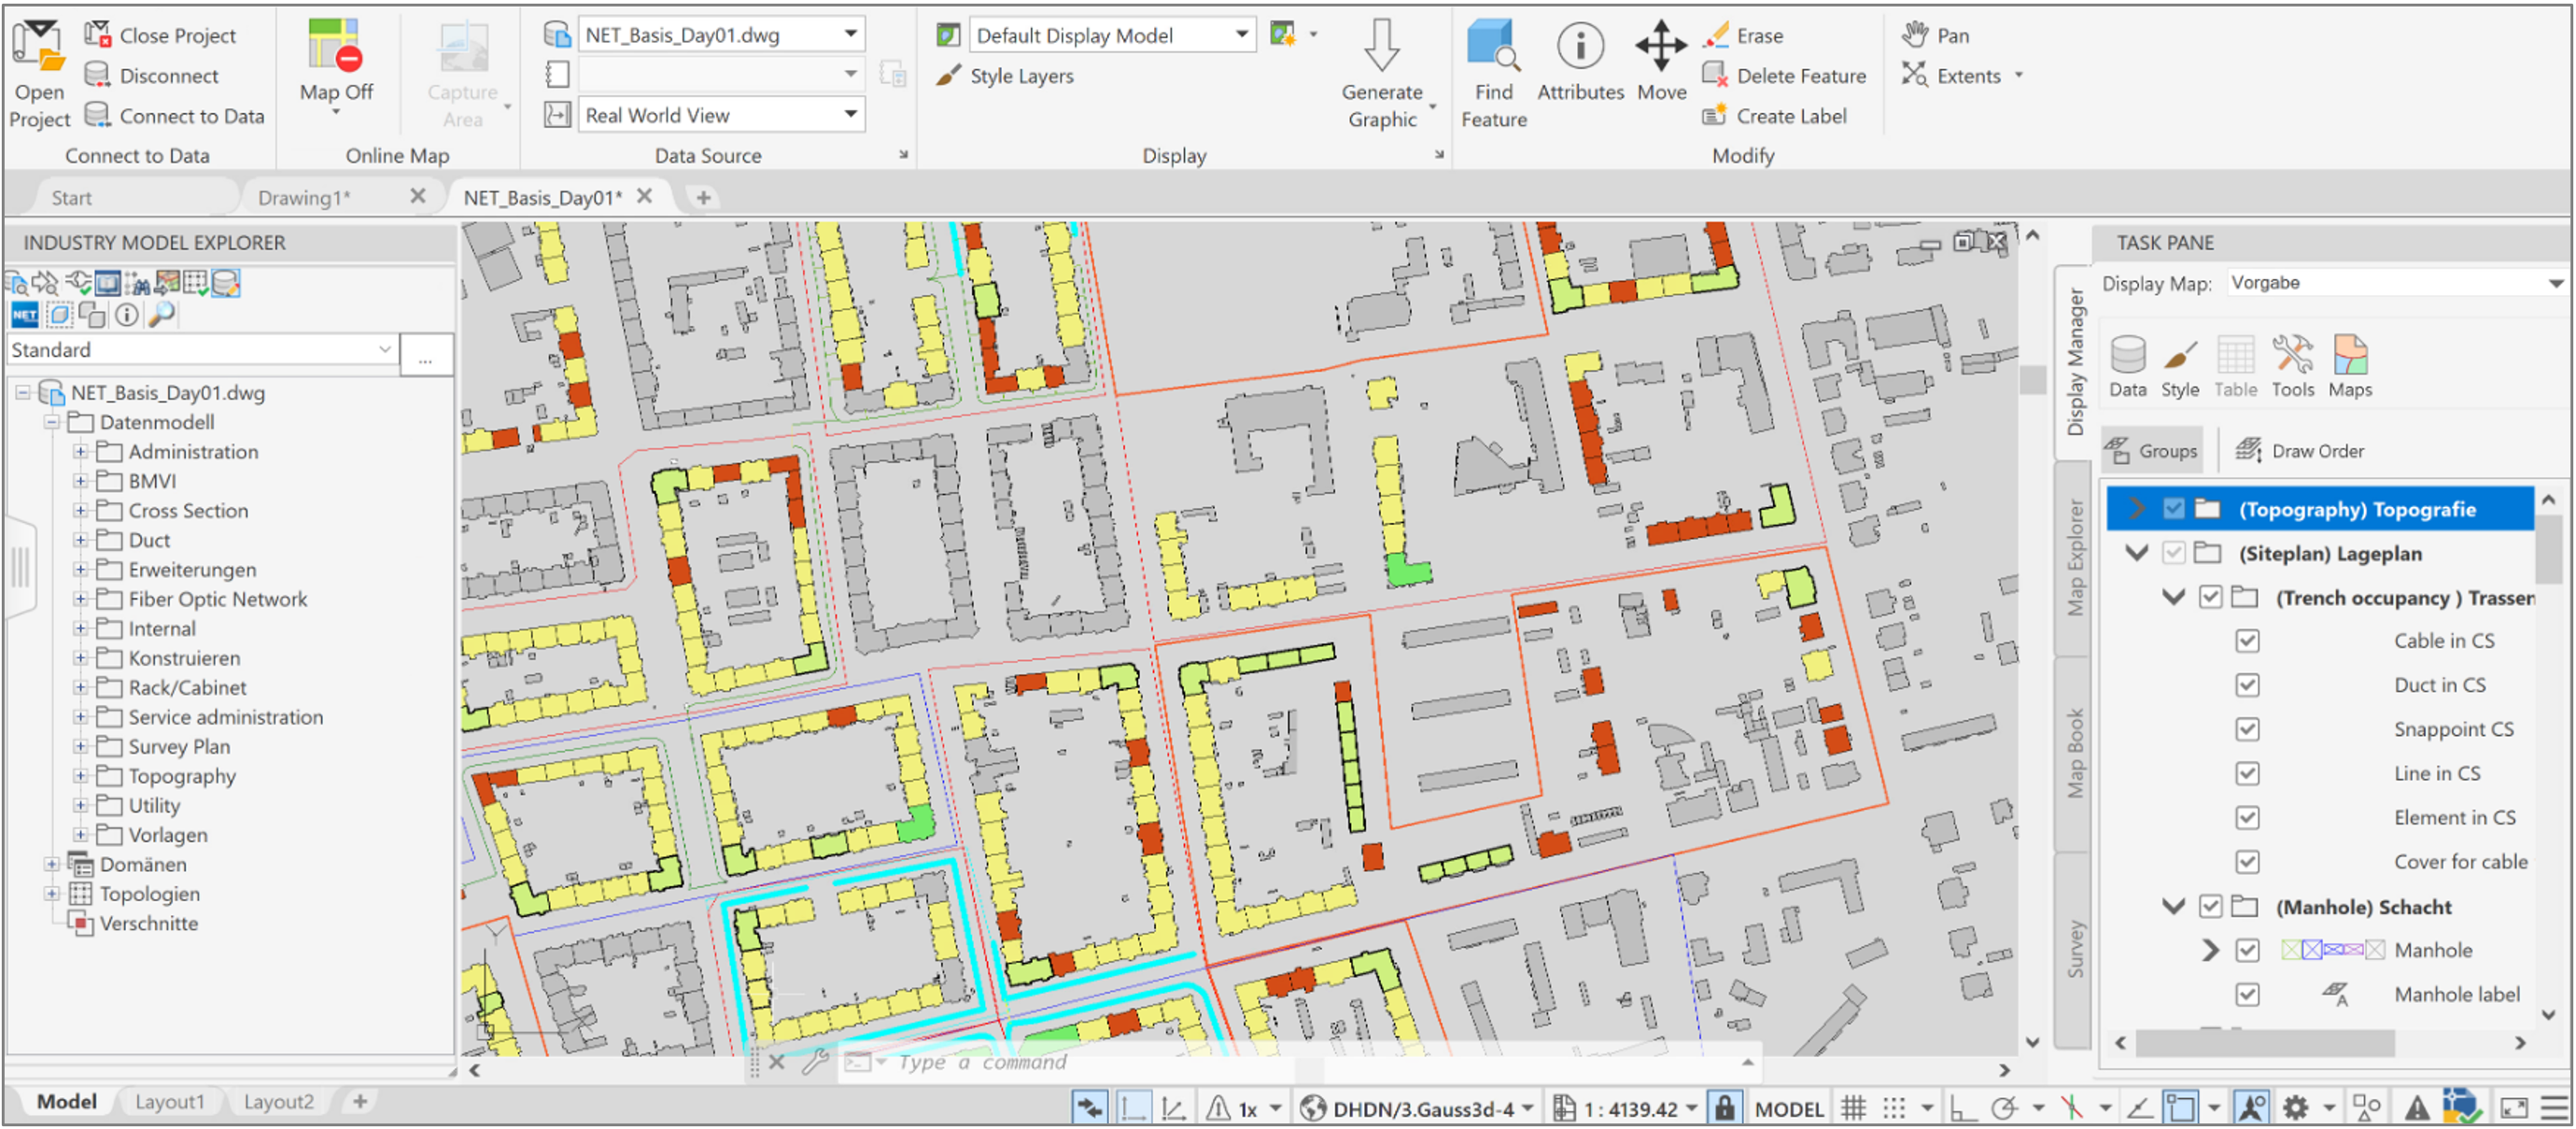
After selecting the display model, the graphic can be created.

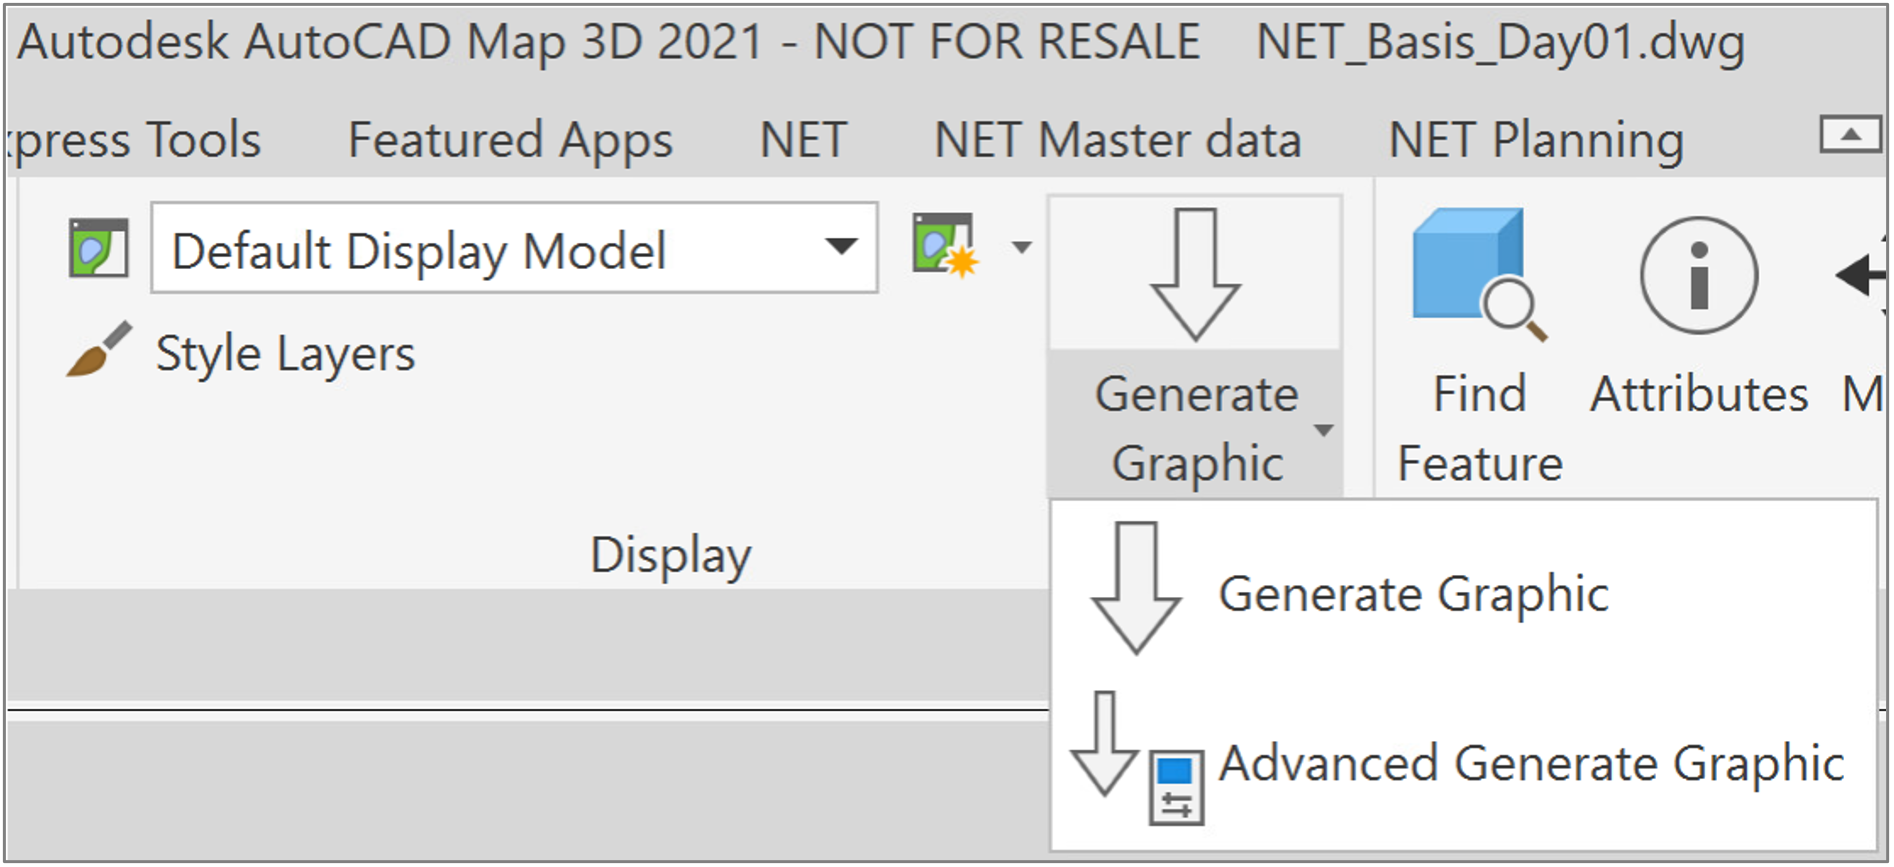
“Generate Graphic” displays the entire geometry of the industry model in the graphic window.
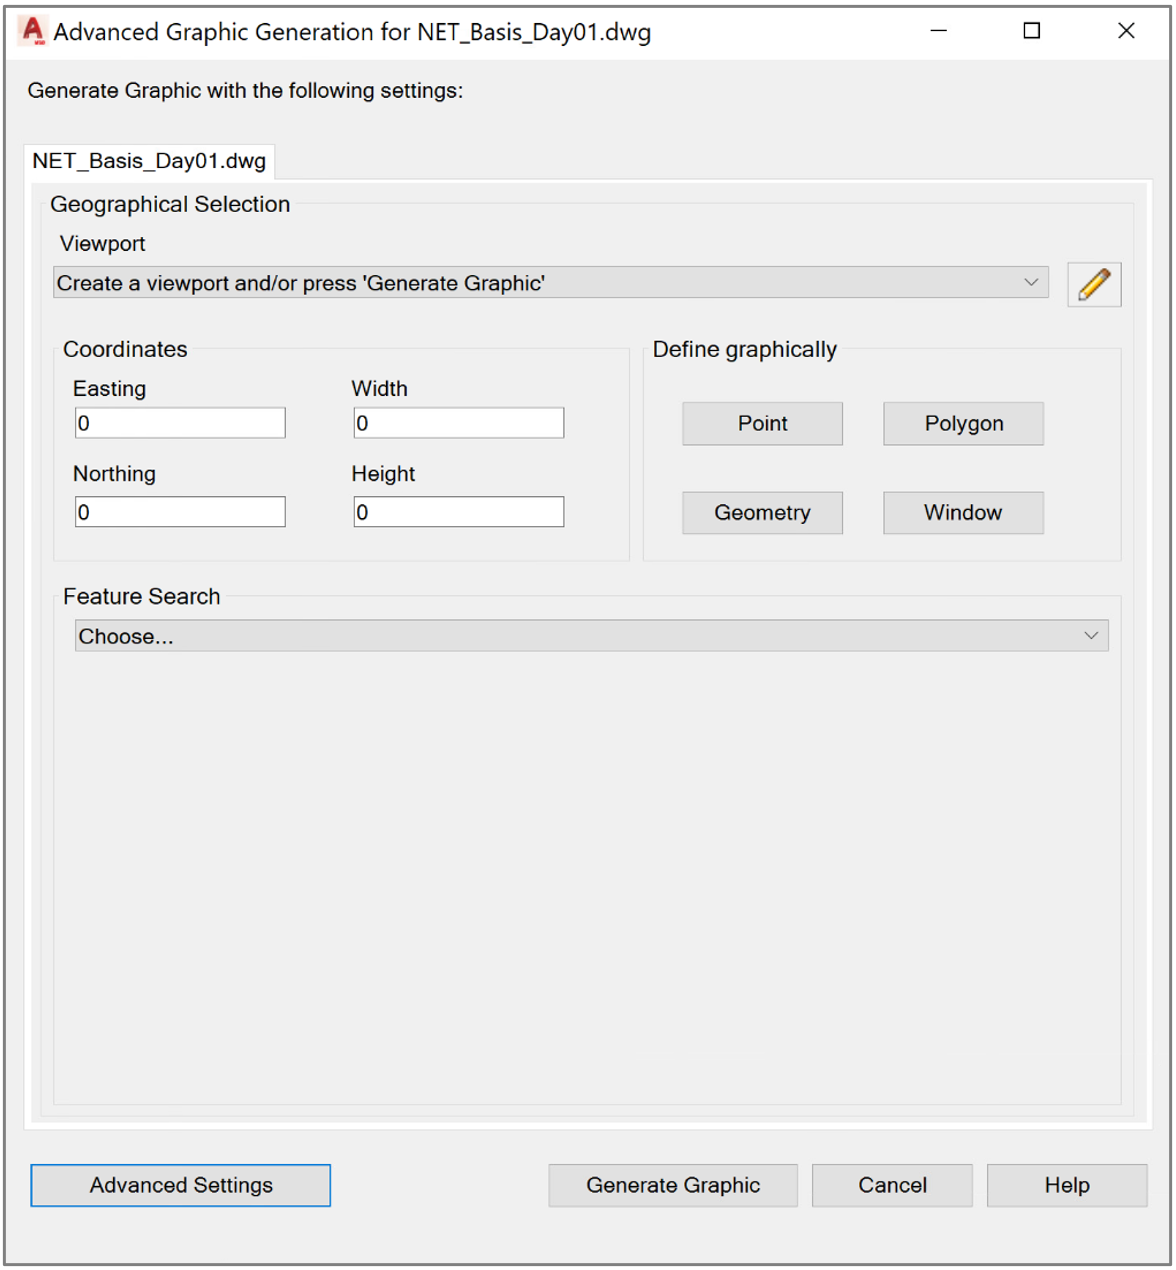
“Advanced Generate Graphic” can be used to create the geometry in a specific area.

This area is to be defined by coordinates and a certain width/height, a graphically defined area or the object selection.

The layers are then displayed in the right task window “Display management” and displayed accordingly in the graphic.